Monitoring Memory Utilization on AWS EC2 Instances

Introduction
Understanding and monitoring memory utilization is crucial for maintaining optimal performance and stability in your AWS EC2 instances. While AWS provides various default metrics through CloudWatch, memory utilization is not among them. In this blog post, we'll walk through the steps to capture memory utilization metrics and visualize them using CloudWatch.
Why Monitor Memory Utilization?
Monitoring memory utilization is essential for identifying performance bottlenecks, optimizing resource usage, and ensuring the smooth operation of your applications. By capturing memory metrics, you gain insights into the health of your EC2 instances and can proactively address issues before they impact your applications.
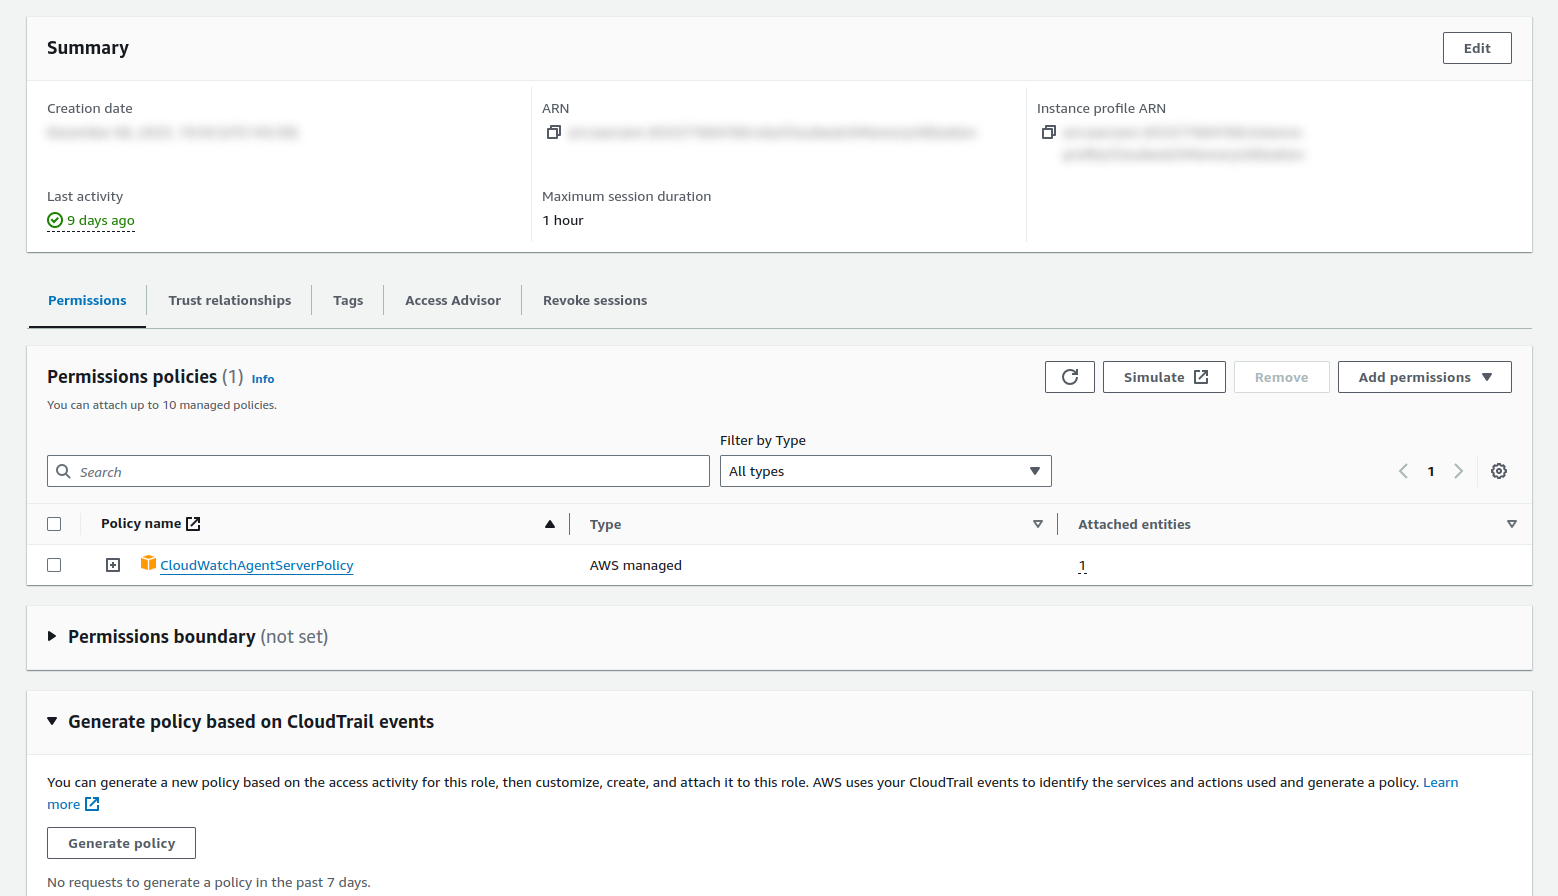
Step 1: IAM Role for CloudWatch
To enable an EC2 instance to publish metrics to CloudWatch, you need to create or update an IAM role. Follow these steps:
Open the AWS Management Console.
Navigate to the "IAM Dashboard."
In the left navigation pane, click on "Roles."
If updating an existing role, attach the "CloudWatchAgentServerPolicy" policy.
If creating a new role, choose "AWS service" as the type, select "EC2" as the use case, and attach the "CloudWatchAgentServerPolicy."
Complete the role creation process by giving it a name and description.
Step 2: Attach IAM Role
If your instance is not attached to Auto Scaling, follow these steps:
Select the instance.
Click on "Actions" -> "Security" -> "Modify IAM Role."
Choose the newly created role and update.
If your instance is under Auto Scaling, update the launch template:
Go to the respective launch template.
Click "Create new version."
In advanced details, under IAM instance profile, select the newly created IAM role.
Launch the template.
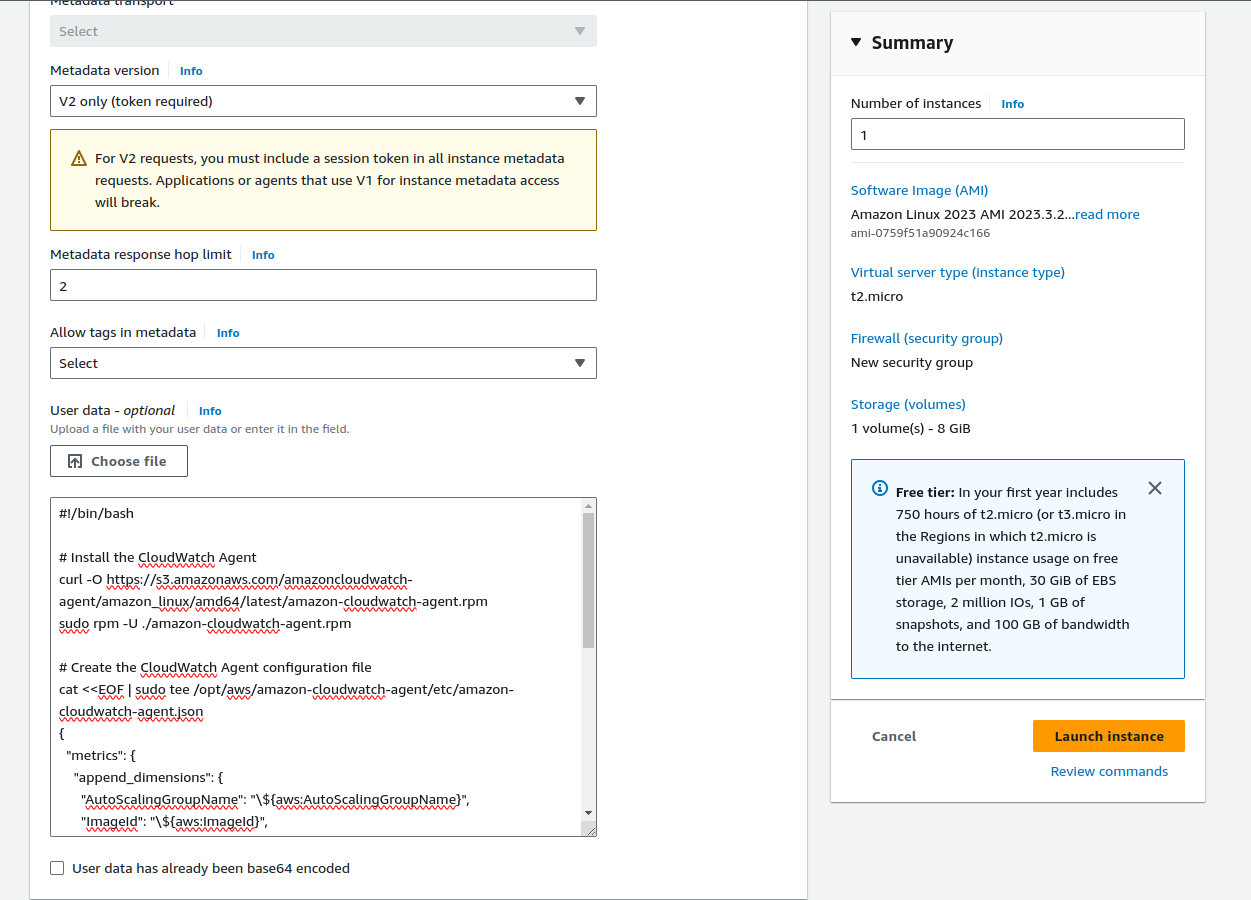
Step 3: Install and Start CloudWatch Agent
Use the following user data script during instance launch:
#!/bin/bash

# Install the CloudWatch Agent
curl -O https://s3.amazonaws.com/amazoncloudwatch-agent/amazon_linux/amd64/latest/amazon-cloudwatch-agent.rpm
sudo rpm -U ./amazon-cloudwatch-agent.rpm

# Create the CloudWatch Agent configuration file
cat <<EOF | sudo tee /opt/aws/amazon-cloudwatch-agent/etc/amazon-cloudwatch-agent.json
{
  "metrics": {
    "append_dimensions": {
      "AutoScalingGroupName": "\${aws:AutoScalingGroupName}",
      "ImageId": "\${aws:ImageId}",
      "InstanceId": "\${aws:InstanceId}",
      "InstanceType": "\${aws:InstanceType}"
    },
    "metrics_collected": {
      "mem": {
        "measurement": ["mem_used_percent"],
        "metrics_collection_interval": 60
      }
    }
  }
}
EOF

# Start the CloudWatch Agent
sudo systemctl start amazon-cloudwatch-agent

# Enable the CloudWatch Agent to start on boot
sudo systemctl enable amazon-cloudwatch-agent
For instances under Auto Scaling, update the launch template with the new version.
For instances not under Auto Scaling, connect to the EC2 instance, create a file memorycapture.sh, copy-paste the user data script, save, change file permissions with chmod +x memorycapture.sh, and execute it.
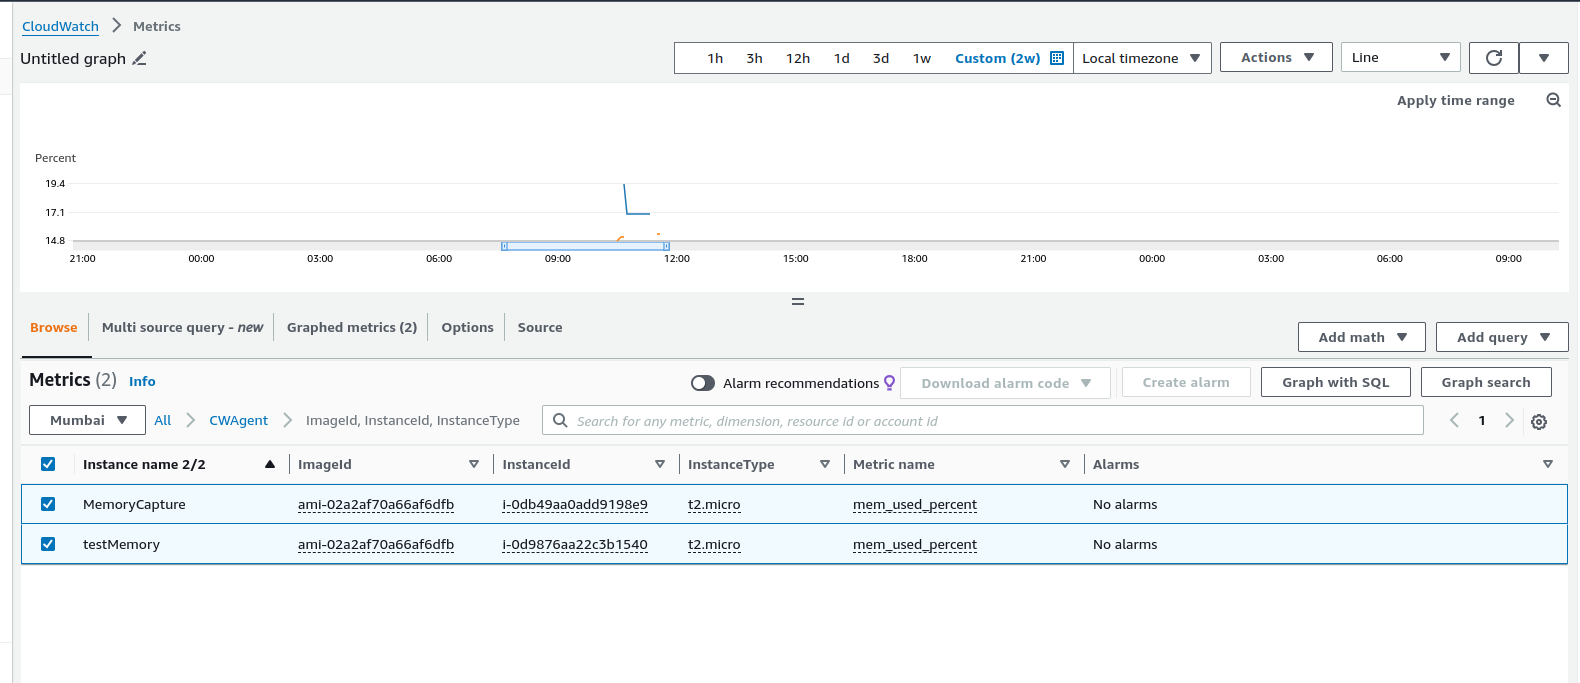
Step 4: Monitor Metrics
After a few minutes, memory metrics will be available in the CloudWatch console:
Navigate to CloudWatch -> Metrics -> All metrics -> CWAgent.
Look for metrics under ImageId, InstanceId, and InstanceType.
Here, you can observe memory metrics for each instance.
Conclusion
Effectively monitoring memory utilization is a critical aspect of maintaining a healthy AWS environment. By following these steps, you can capture and visualize memory metrics, allowing you to make informed decisions and ensure optimal performance for your EC2 instances. Regularly reviewing these metrics empowers you to proactively address issues and enhance the overall reliability of your applications.


